

Mastering IELTS Writing Task 1: A Journey with Wrotels
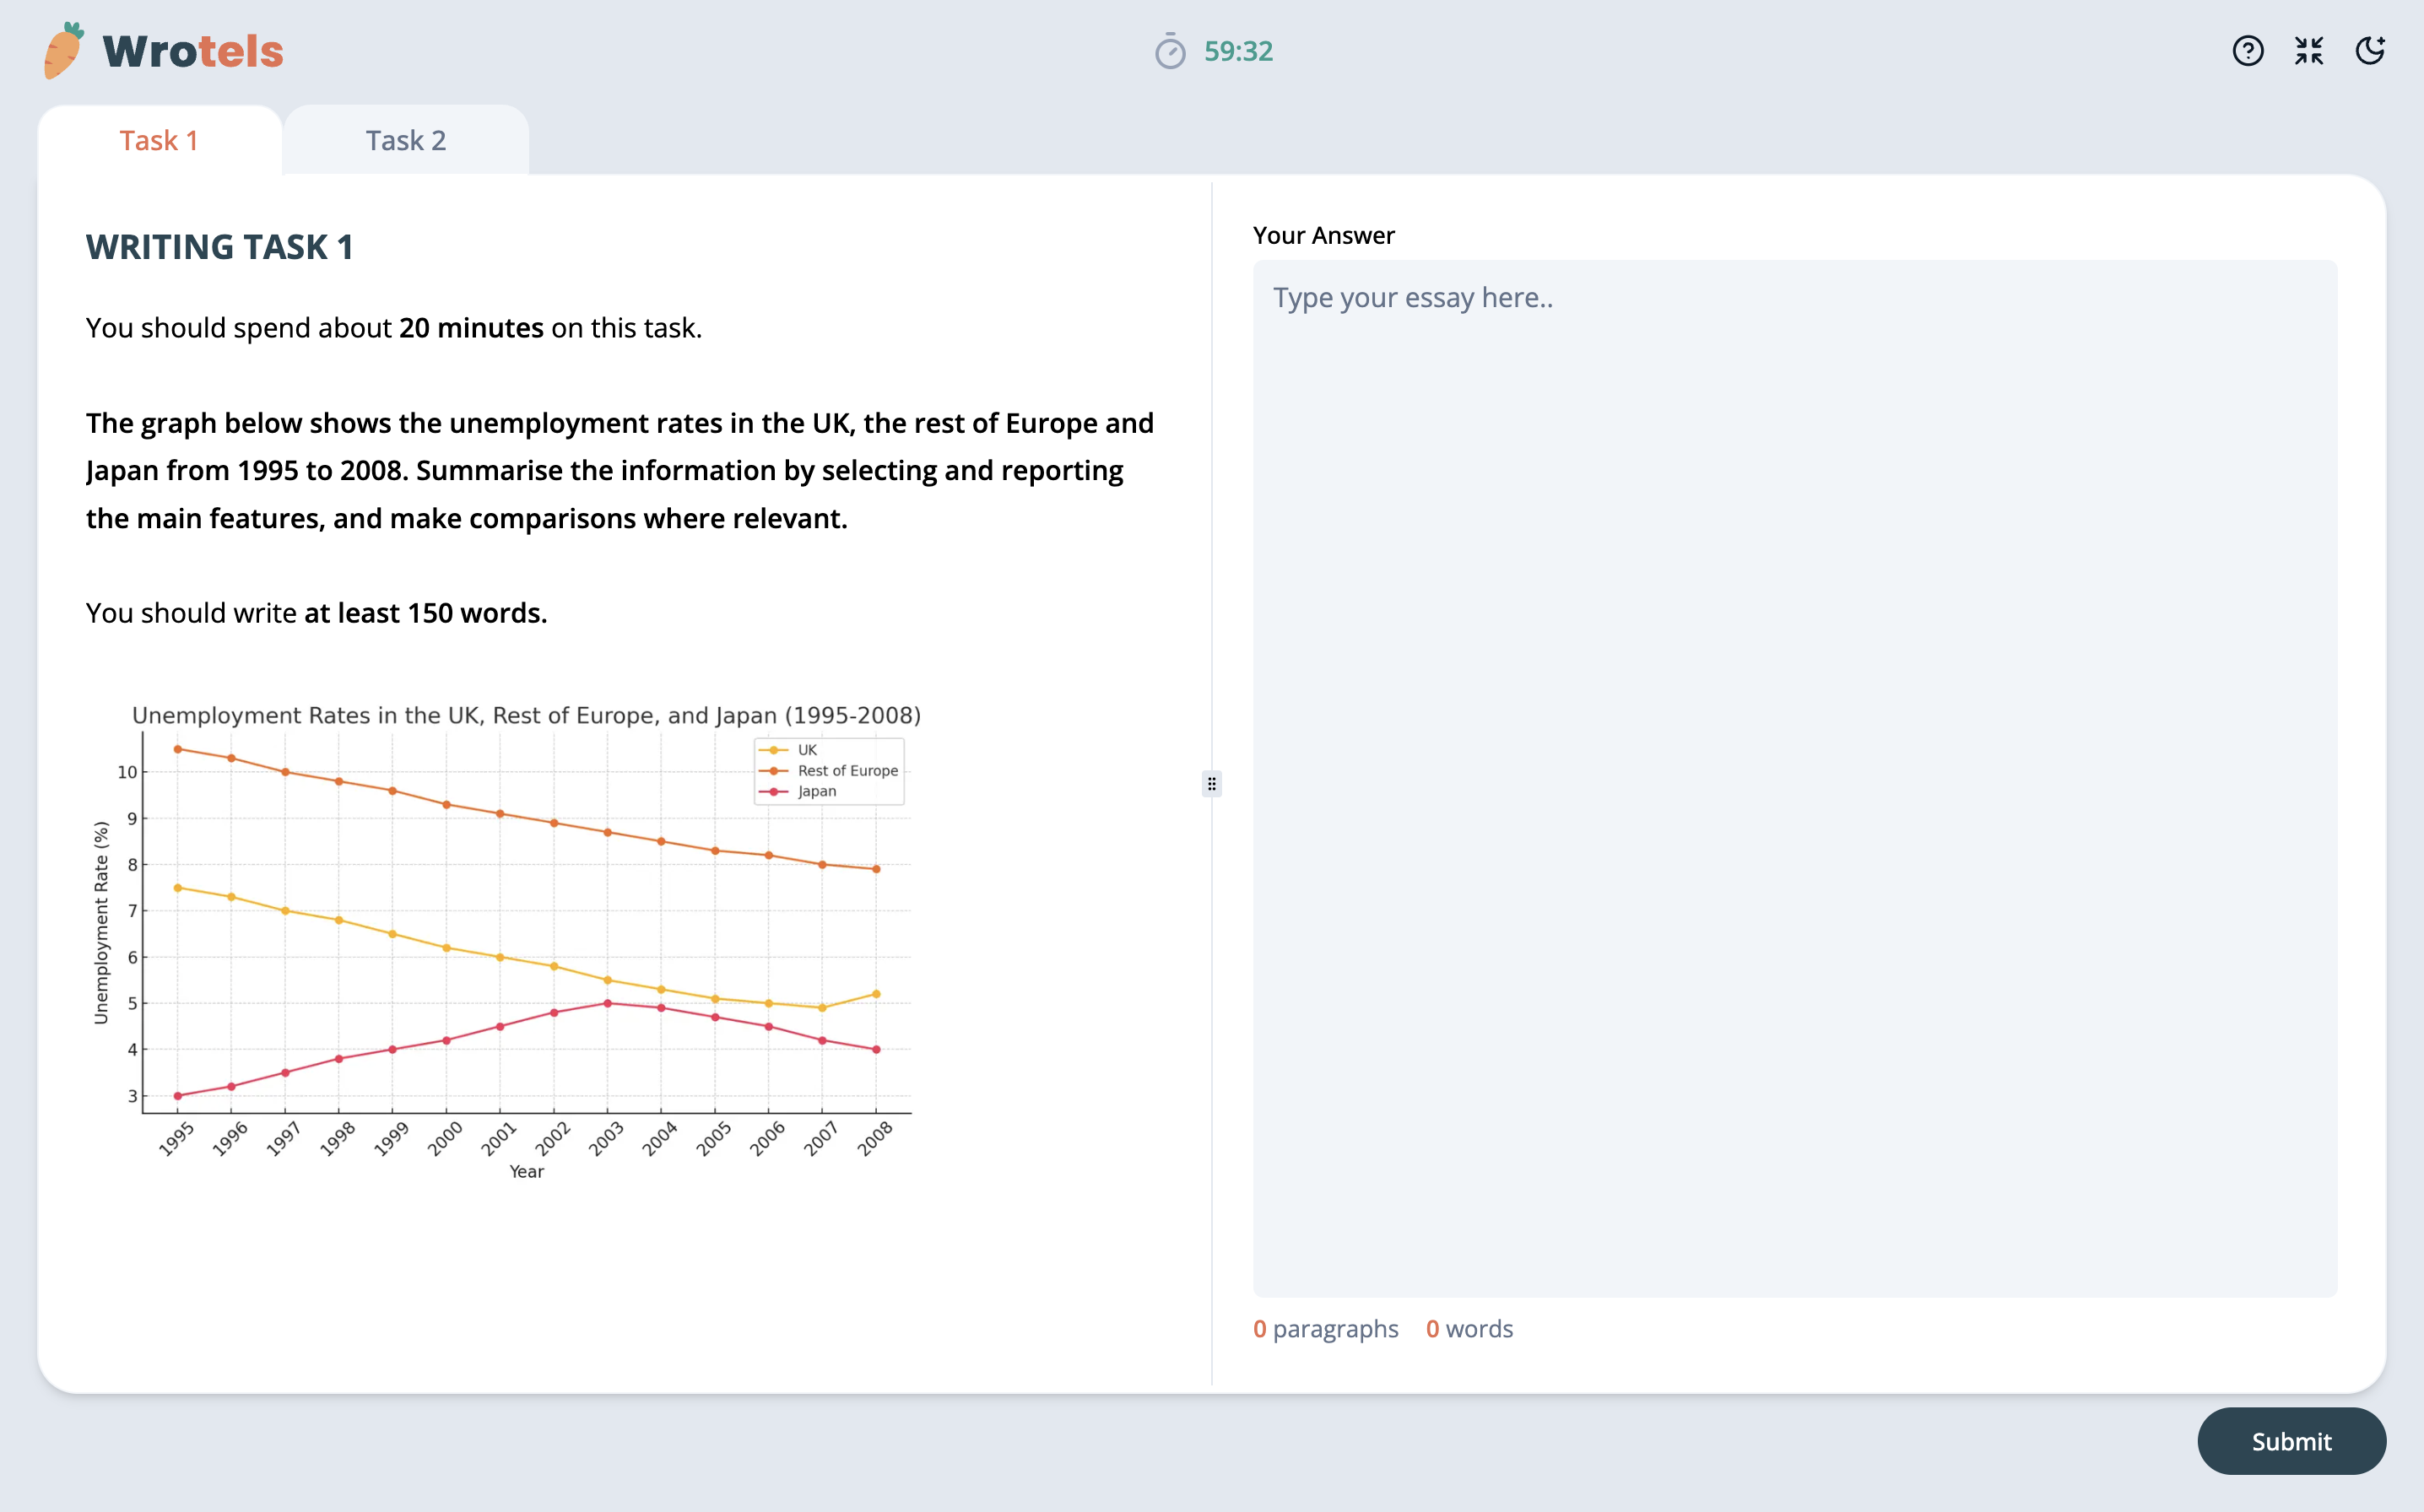
Let’s imagine this: you open your IELTS Writing Task 1, and a line graph stares back at you. You blink. Numbers, axes, categories, dates — a jungle of data. And then it hits you:
How do I turn this into a high-scoring report?
That’s where this story begins — the journey of transforming complex data into a beautifully written report. At Wrotels, we don’t just simulate IELTS writing. We empower you to narrate data in IELTS Writing Task 1 like a pro. Here's how you can too.
Step 1: Understanding the Blueprint
Before you dive into writing, you need a map.
Think of your IELTS Task 1 response like building a house. You need structure — and here's what that structure looks like:
The Foundation: Introduction
Start strong by paraphrasing the question. Instead of repeating the prompt, rephrase it.
Example:
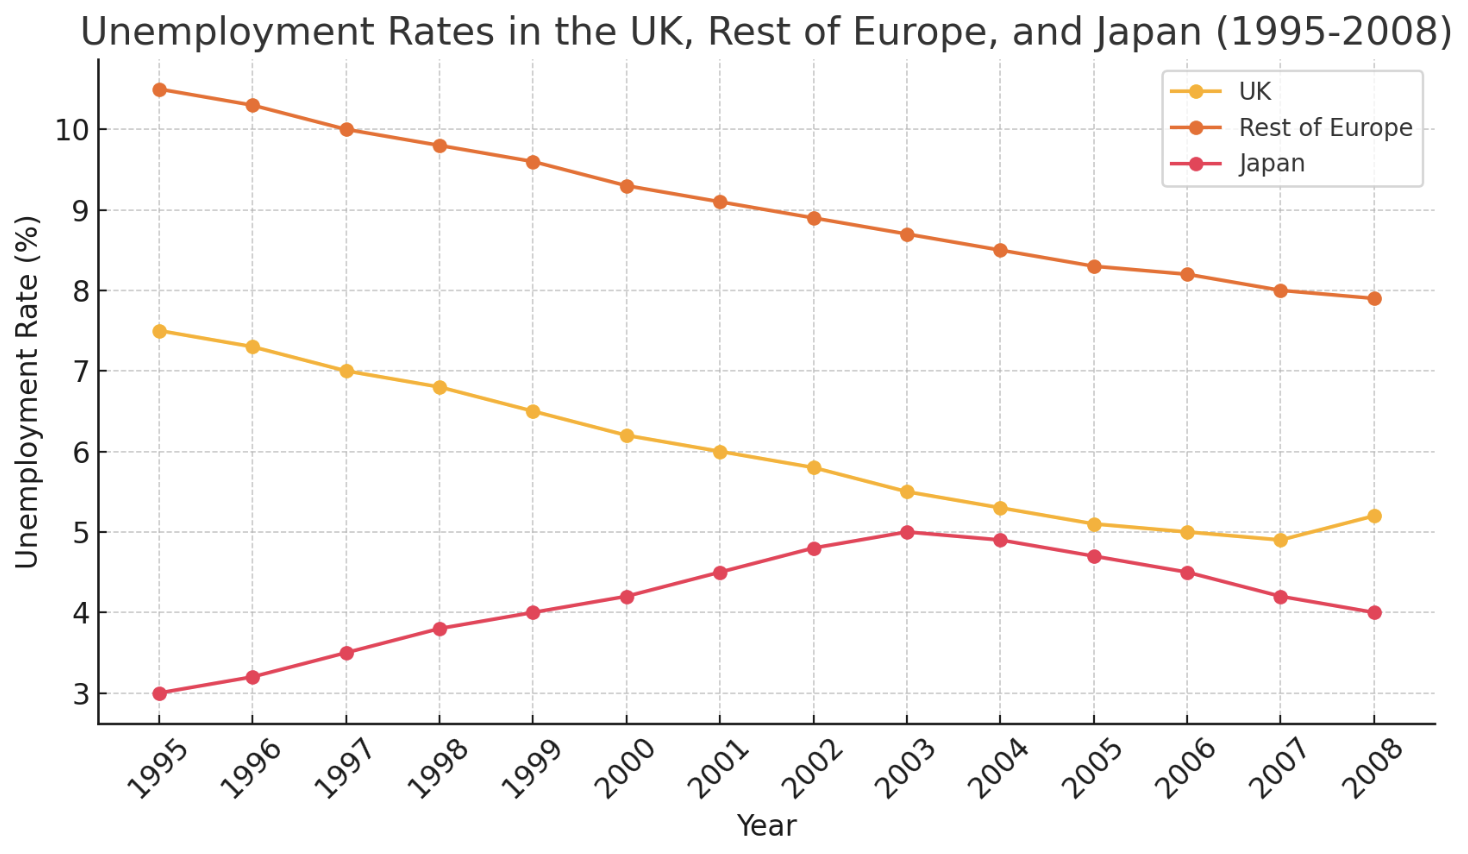
The line graph illustrates the unemployment rates in the UK, the rest of Europe, and Japan between 1995 and 2008.
✨ Tips:
- Use words like: illustrates, depicts, shows, reveals
- Avoid copying phrases directly from the prompt
Step 2: Painting the Big Picture
This is your Overview — a snapshot of what’s happening.
Imagine stepping back from the graph and asking:
- Is there an upward or downward trend?
- Which category dominates?
- Are there significant changes?
Example:
Overall, the unemployment rate in the rest of Europe remained the highest throughout the period, while Japan had the lowest figures despite some fluctuations.
Step 3: Zoom In — The Body Paragraphs
Here’s where you zoom in and show off your ability to group, compare, and incorporate data.
Split the data logically. For example:
- Group 1: Rest of Europe (consistently high, gradual decline)
- Group 2: UK (steady downward trend with slight rise in 2008)
- Group 3: Japan (fluctuating, but generally low)
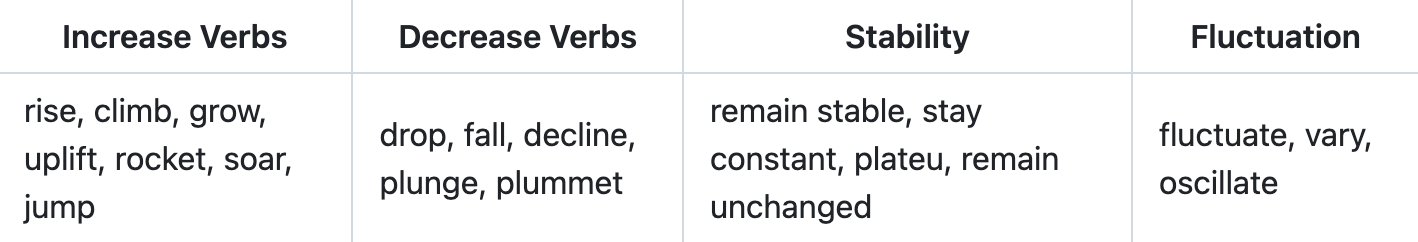
Add powerful verbs and adverbs:
- Verbs: decreased, fluctuated, rose, remained steady
- Adverbs: significantly, slightly, steadily, sharply
Example Sentence:
Unemployment in Japan rose gradually from 3% in 1995 to around 5% in 2003 before declining to 4% by 2008.
Step 4: Spice Up Your Sentences
Using a variety of sentence types keeps your writing natural and score-worthy.
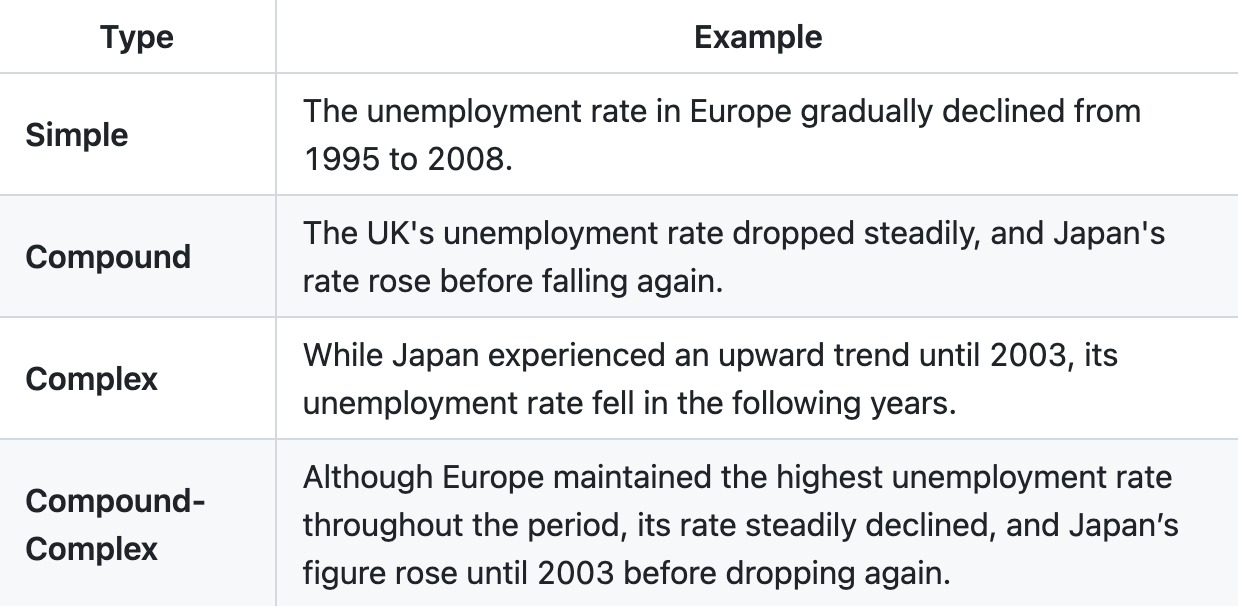
Also, change your sentence subjects:
- “There was a consistent decrease in UK unemployment.”
- “Between 1995 and 2008, Europe’s rate dropped by over 2 percentage points.”
- “By 2008, Japan had the lowest unemployment among the three regions.”
Pro Tips: Vocabulary Magic
Use precise vocabulary to describe changes.
Example:
The unemployment rate in the rest of Europe decreased steadily from over 10% in 1995 to below 8% in 2008.
Don’t forget approximation words: around, approximately, nearly, just under — especially when exact figures aren’t necessary.
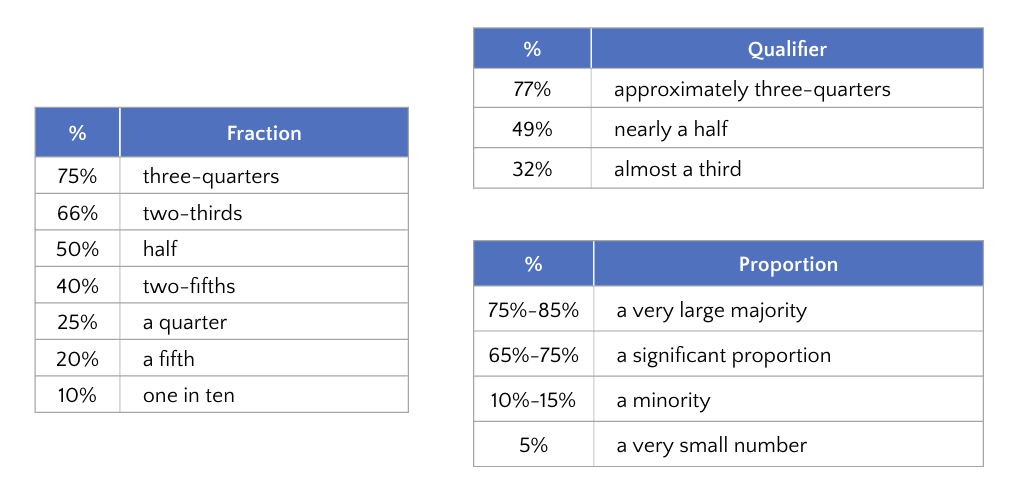
Bringing Numbers to Life
Turn boring stats into beautiful comparisons.
- Fractions: “Roughly half of the UK’s unemployment rate in 1995 was seen in Japan.”
- Percentages: “Europe’s unemployment rate was consistently above 8%.”
- Comparisons: “Japan’s unemployment peaked at around 5%, while the UK never exceeded 7.5%.”
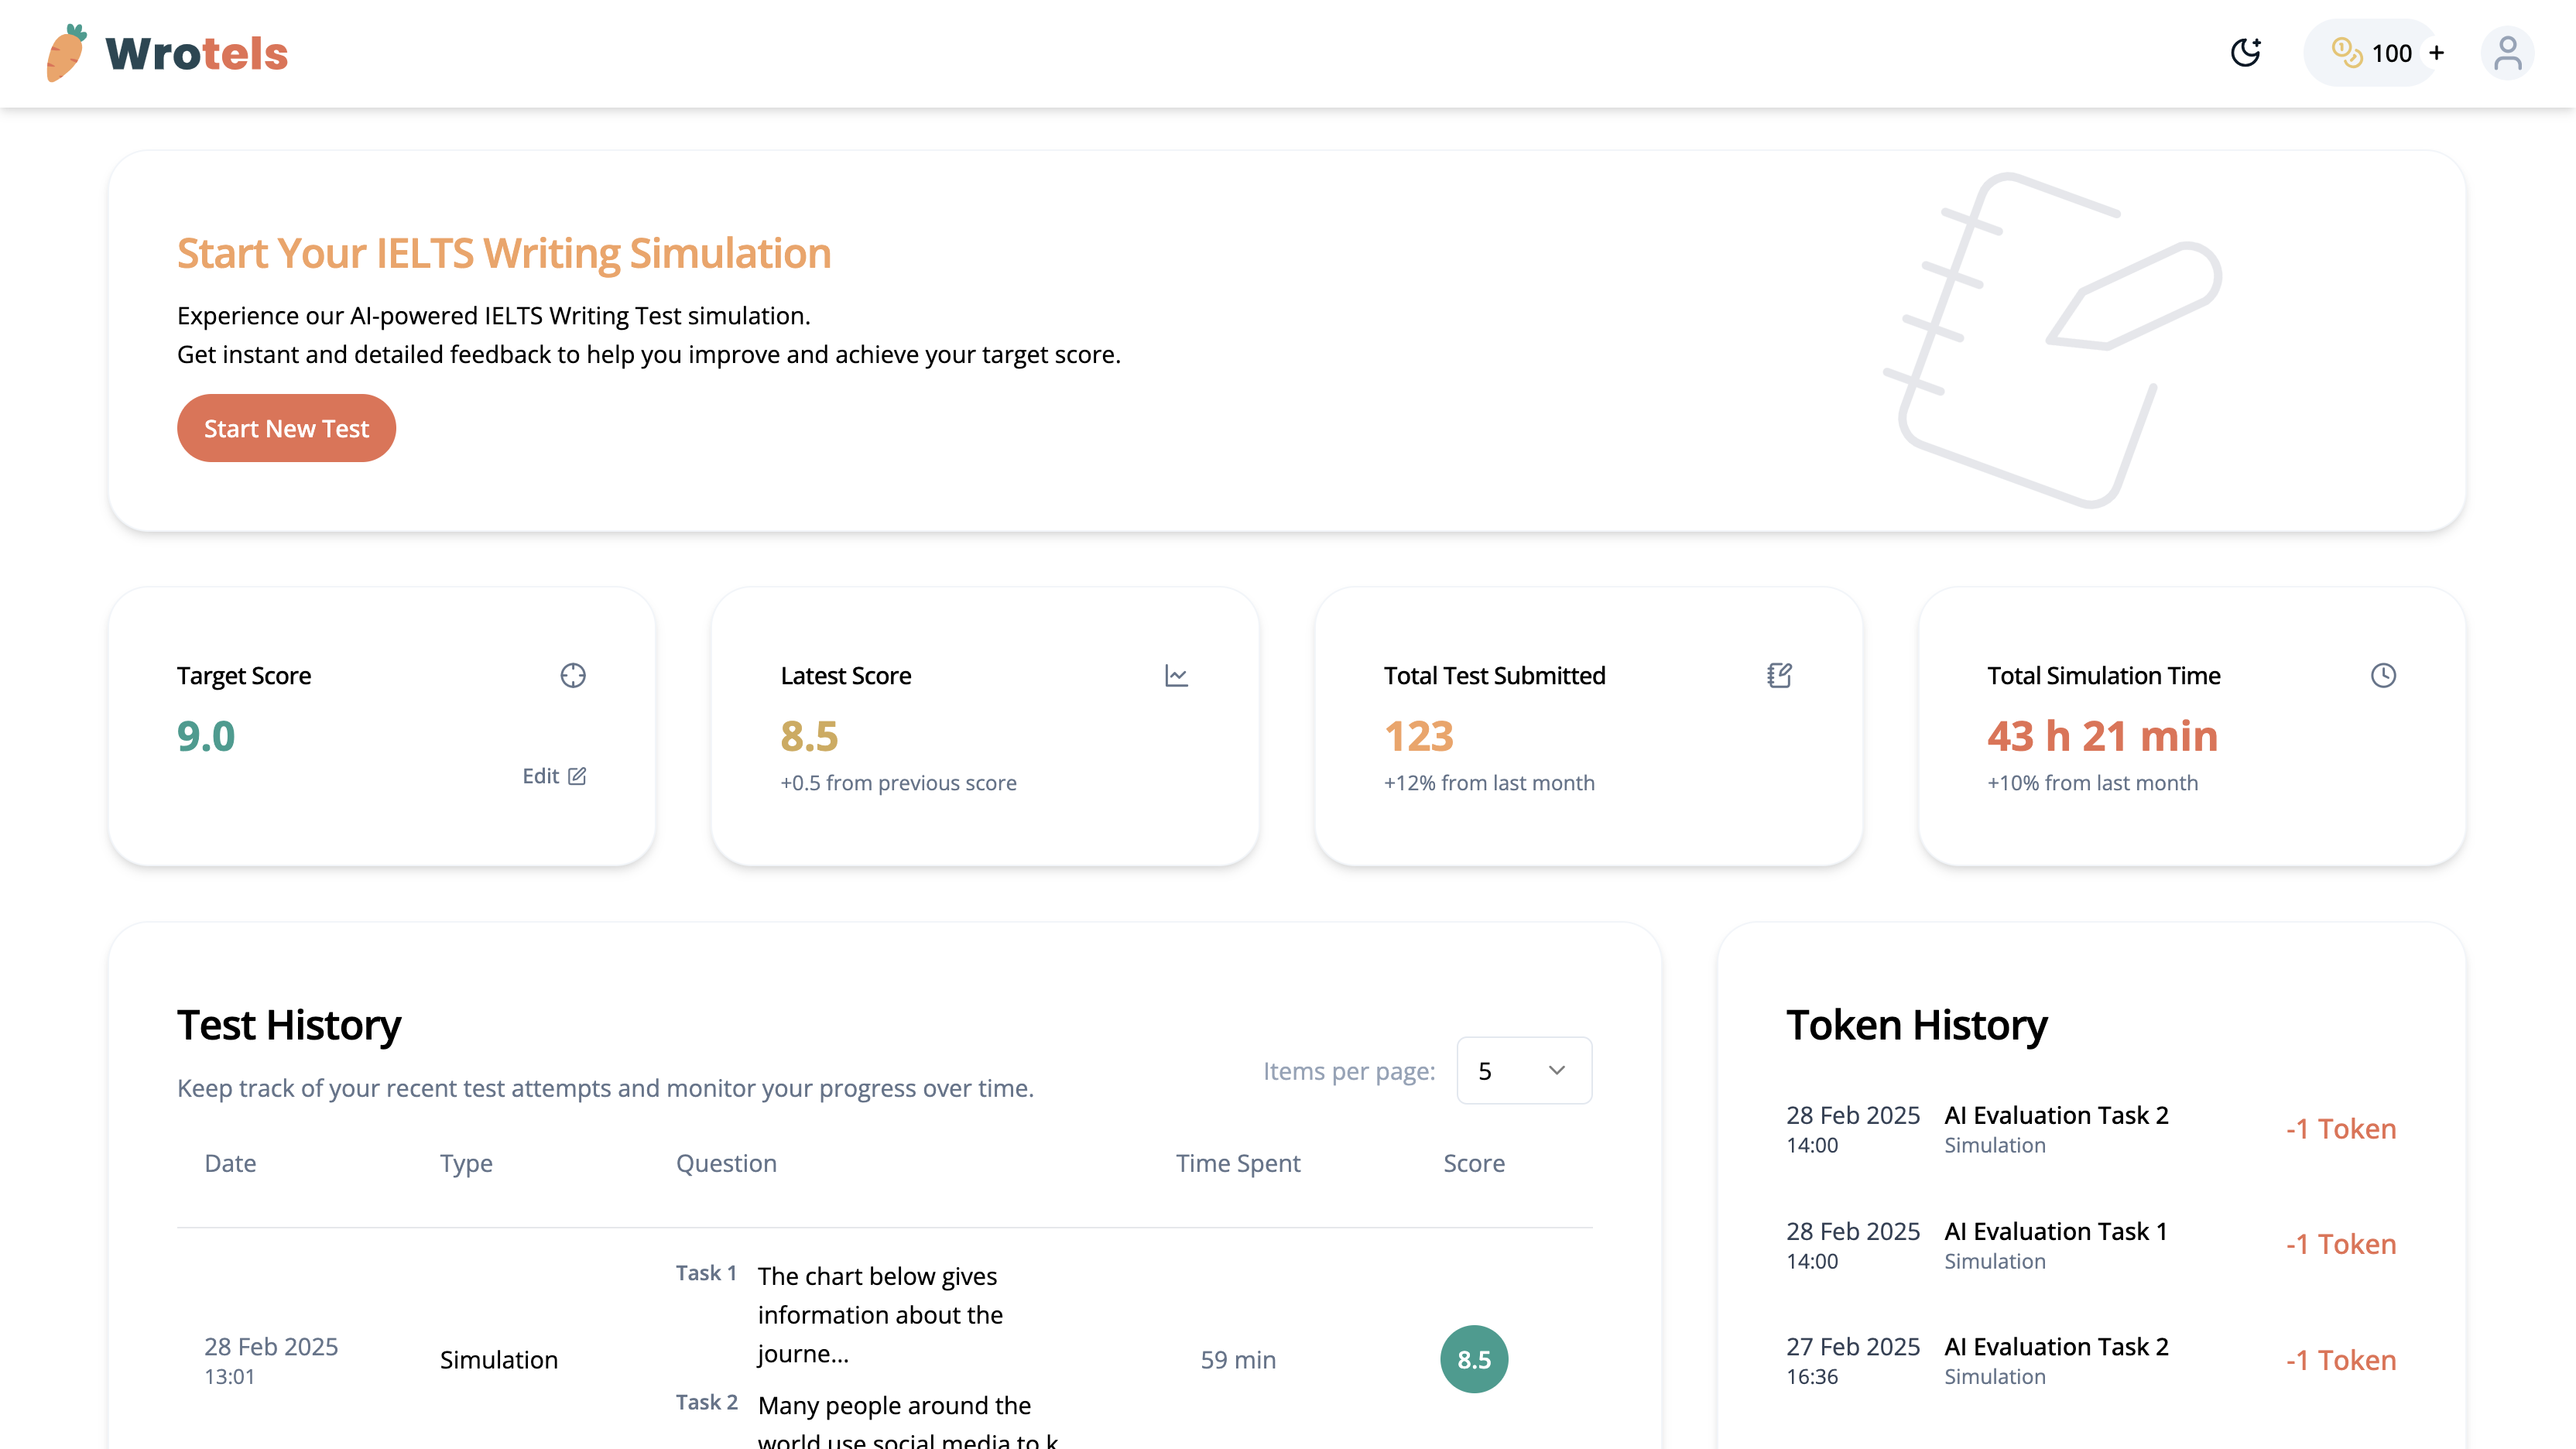
The Final Touch: Practice Makes Perfect
To master report writing, you need to practice like it's real. And that’s exactly what Wrotels is built for.
With our AI-powered IELTS Writing Simulation, you'll get:
- Real IELTS-style questions
- Instant structure feedback
- Suggestions on vocabulary, grammar, and flow
Think of it as your personal IELTS writing coach — available 24/7.
Your Story Starts Here
The next time a graph greets you in the exam, smile. You know the plot. You’ve practiced the narrative. And with Wrotels by your side, you’re not just describing data — you’re telling a compelling story.
Start your writing journey today — at Wrotels.com